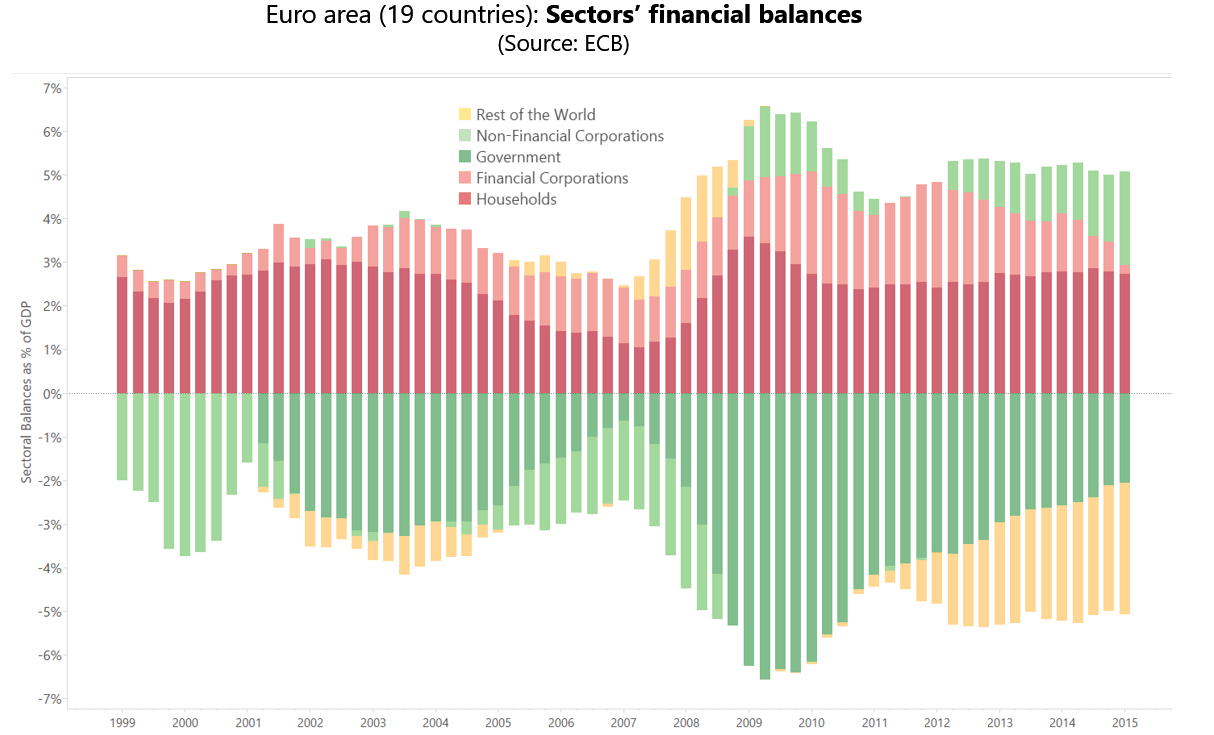
This is an updated chart of the flow of financial savings and debt in the euro area (EA).

For each quarter, the red bars (when positive) measure the flow of financial savings to resident households (dark red) and financial corporations (light red).
The flow of financial savings has been consistently positive throughout the period, reflecting the quarterly addition to the stock of private savings. Notice the recent decline of financial savings of financial corporations.